The Scorecard Report allows you to view your percentage scores in real time anytime. You can view this feedback in a variety of helpful ways.
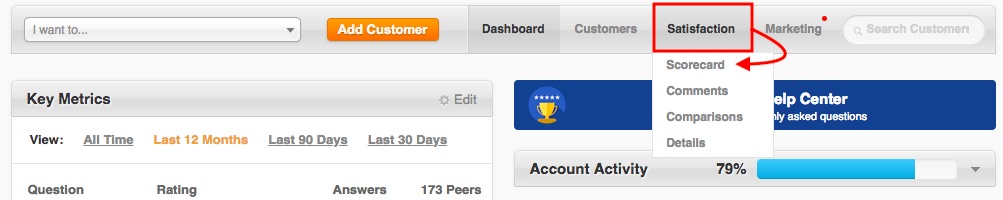
Hover over Satisfaction in your top menu and click Scorecard to access the report.
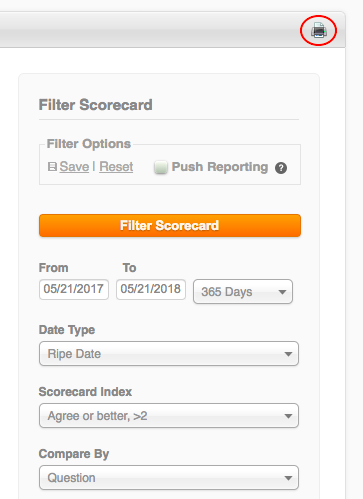
Using the Filter Options on the right, start to hone in on the feedback you want to isolate. The report defaults to All Time Compared by Quarter, but you can change the options however you need.
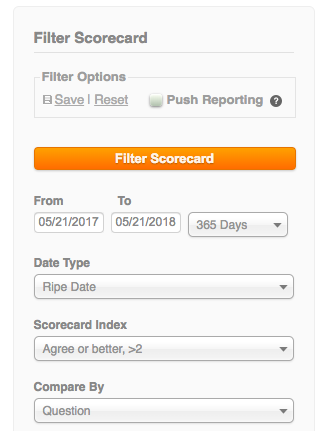
Learn more about Date Types here.
Scorecard Index
The Scorecard Index allows you to view what percentage of customers fall within a given parameter. By default, the report is set to “Agree or better, >2”. The following explains each Index:
- Strongly Agree, 4 : To see the percentage of customers who scored 4’s on questions, by comparison.
- Agree or better, >2 : To see the percentage of customers who scored 3’s and 4’s on questions, by comparison (this is what we market for you).
- Somewhat Agree or better, >1 :To see the percentage of customers who scored 2’s, 3’s and 4’s on questions, by comparison.
- Disagree or better, >0 : To see the percentage of customers who scored above a 0 on questions, by comparison.
- Agree or worse <4 : To see the percentage of customers who did not score a 4 on questions, by comparison.
- Somewhat Agree or worse, <3 : To see the percentage of customers who scored below a 3 on questions, by comparison.
- Disagree or worse, <2 : To see the percentage of customers who scored below a 2 on questions, by comparison.
- Strongly Disagree, 0 : To see the percentage of customers who scored a 0, by comparison.
- GQI : To see the percentage of your answers that are “4” minus the percentage that are “0,” “1,” or “2.” Also known as NPS, or net promoter score. Learn more here.
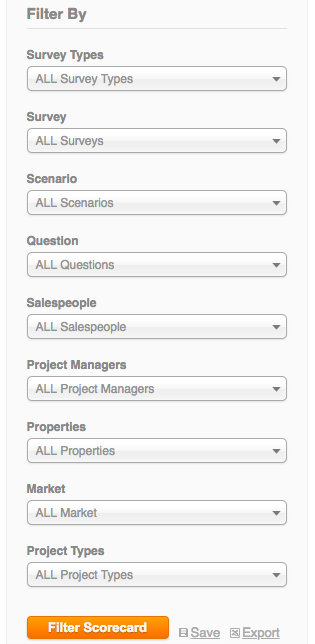
More Filter Options
You can also isolate your report by specific fields, using default and custom filters.
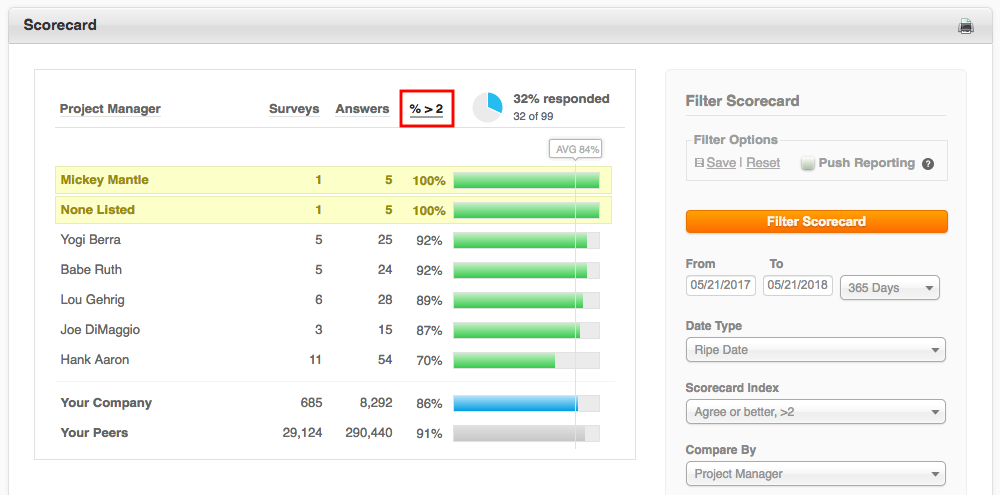
Once you have your parameters set, click “Filter Scorecard” to update the percentage bars in the main viewer. These can now be sorted alphabetically, by the number of surveys completed, by the number of answers considered for the score, and by the score itself. To sort, click the column header in the main viewer:
Save and Schedule your Scorecard
Using the Scheduling option at the top right, you can have this report delivered to your inbox when it’s most convenient or useful to you. Learn more about push reports.
Print the Scorecard Report
If you want to share this report with members of your team, you can print this report to a printer or PDF using the print icon at the top right of your report.
Want to see just a few questions at a time for specific parameters? Bundle your questions for better insights.
Use the Comments Report to investigate negative feedback, or read here on how to improve your response rate.